Configure metrics
Configure the OpenZiti controller, metrics bridge, and zrok controller to collect and store usage metrics in InfluxDB.
Configure the OpenZiti controller
-
Add this stanza to the OpenZiti controller configuration to append
fabric.usageevents to a file:events:jsonLogger:subscriptions:- type: fabric.usageversion: 3handler:type: fileformat: jsonpath: /tmp/fabric-usage.jsonAdjust
events/jsonLogger/handler/pathto wherever you want to send these events for ingestion into zrok. Consult the OpenZiti docs for additional options that control file rotation. -
Add the following to the
networkstanza of the OpenZiti controller configuration to increase the reporting frequency. By default, the OpenZiti events infrastructure reports and batches events in 1-minute buckets—too large an interval for a responsive zrok metrics experience. This increases the frequency to every 5 seconds:network:intervalAgeThreshold: 5smetricsReportInterval: 5s -
Add this stanza to the router configuration for every router on your OpenZiti network:
metrics:reportInterval: 5sintervalAgeThreshold: 5s -
Restart all components of your OpenZiti network for the configuration changes to take effect.
Configure the zrok metrics bridge
zrok uses a metrics bridge component (running as a separate process) to consume fabric.usage events from the OpenZiti
controller and publish them onto an AMQP queue.
-
Add this stanza to your zrok controller configuration:
bridge:source:type: fileSourcepath: /tmp/fabric-usage.jsonsink:type: amqpSinkurl: amqp://guest:guest@localhost:5672queue_name: eventsThis consumes
fabric.usageevents from the file specified in the OpenZiti controller configuration and publishes them onto an AMQP queue. -
Start RabbitMQ as your AMQP implementation. The default RabbitMQ configuration works as a Docker container:
docker run -it --rm --name rabbitmq -p 5672:5672 -p 15672:15672 rabbitmq:3.11-management -
Start the zrok metrics bridge by pointing it at your zrok controller configuration:
zrok2 controller metrics bridge <path/to/zrok-controller.yaml>
Configure zrok metrics
Add a metrics section to your zrok controller configuration:
metrics:
  agent:
    source:
      type:         amqpSource
      url:          amqp://guest:guest@localhost:5672
      queue_name:   events
  influx:
    url:            "http://127.0.0.1:8086"
    bucket:         zrok  # the bucket and org must be
    org:            zrok  # created in advance in InfluxDB
    token:          "<secret token>"
This configures the zrok controller to consume usage events from the AMQP queue and write them to InfluxDB. The InfluxDB organization and bucket must be created in advance—the zrok controller won't create them for you.
Test metrics
With all components configured and running, use zrok test loop or manually create shares to generate traffic on the
zrok instance. If everything is working correctly, log messages from the controller will look like this:
[5339.658]    INFO zrok/controller/metrics.(*influxWriter).Handle: share: 736z80mr4syu, circuit: Ad1V-6y48 backend {rx: 4.5 kB, tx: 4.6 kB} frontend {rx: 4.6 kB, tx: 4.5 kB}
[5349.652]    INFO zrok/controller/metrics.(*influxWriter).Handle: share: 736z80mr4syu, circuit: Ad1V-6y48 backend {rx: 2.5 kB, tx: 2.6 kB} frontend {rx: 2.6 kB, tx: 2.5 kB}
[5354.657]    INFO zrok/controller/metrics.(*influxWriter).Handle: share: 5a4u7lqxb7pa, circuit: iG1--6H4S backend {rx: 13.2 kB, tx: 13.3 kB} frontend {rx: 13.3 kB, tx: 13.2 kB}
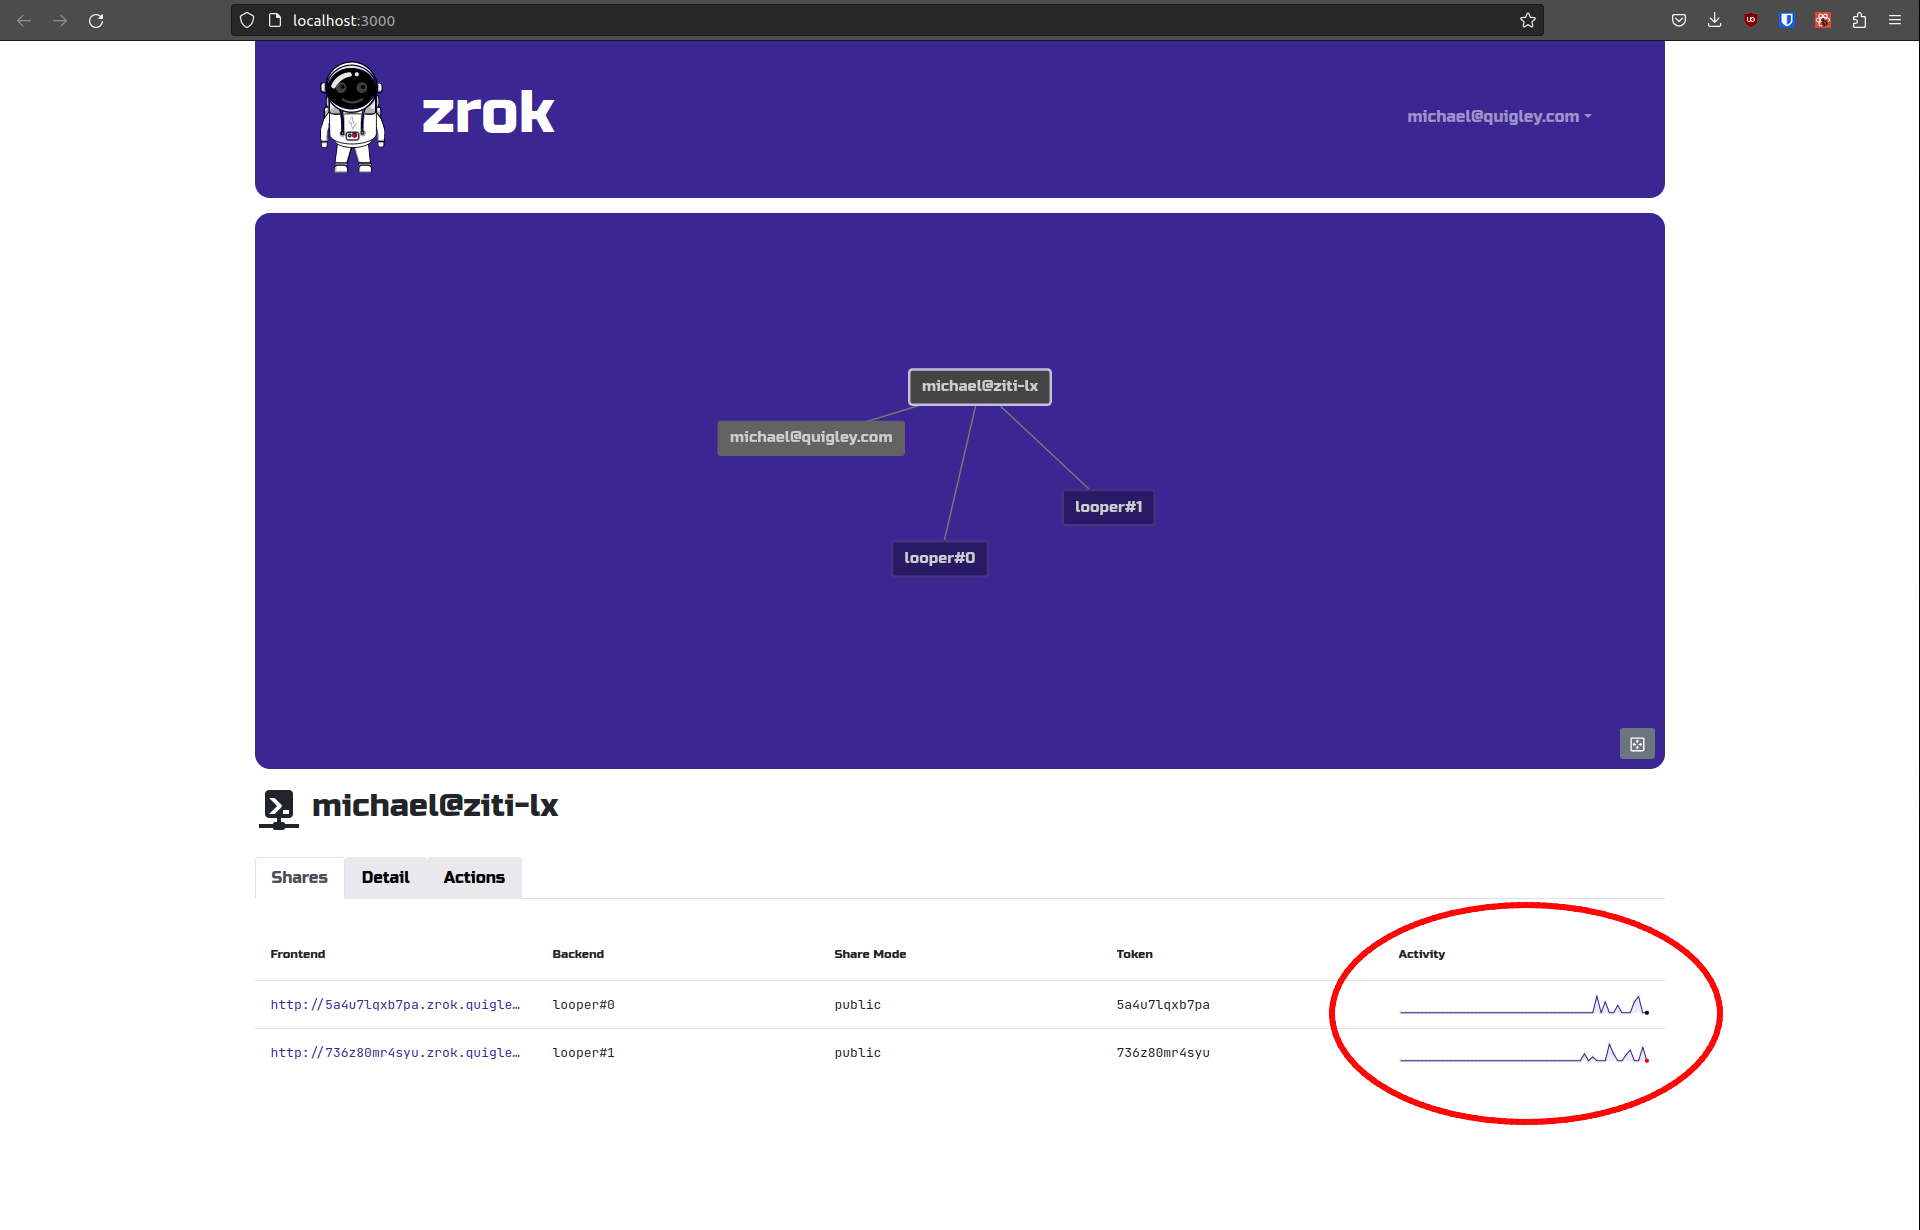
The zrok web console should also show activity for your shares:
With metrics configured, you might be interested in limits.