Metrics and limits
Metrics and limits are two complementary systems for operating a self-hosted zrok instance at scale.
Metrics give you visibility into usage across your service instance. zrok builds on top of the fabric.usage event
type from OpenZiti, routing usage events through a metrics bridge and into InfluxDB, where they power the activity
graphs in the zrok web console.
Limits let you control how much of that usage any single account can consume—both in terms of resource counts (environments, shares, names) and data transfer bandwidth. When an account exceeds a threshold, the limits agent can warn the user or disable their shares until usage falls back within bounds.
Metrics architecture
A fully configured, production-scale zrok service instance looks like this:
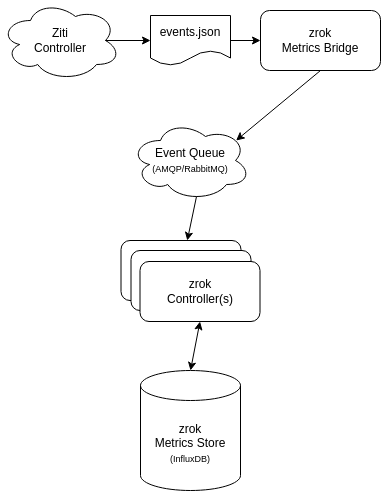
The OpenZiti controller has a number of ways to emit events. The zrok controller has several ways to consume
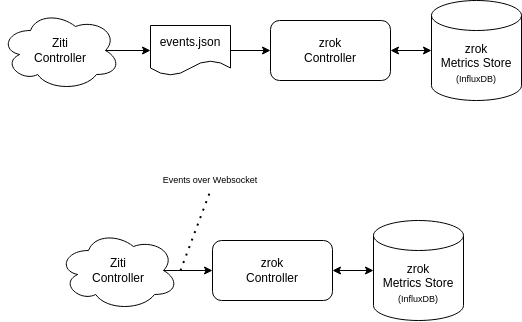
fabric.usage events. Smaller installations could be configured in these ways:
Environments that horizontally scale the zrok control plane with multiple controllers should use an AMQP-based queue to
"fan out" the metrics workload across the entire control plane. Simpler installations that use a single zrok controller
can collect fabric.usage events from the OpenZiti controller by "tailing" the events log file, or collecting them from
the OpenZiti controller's websocket implementation.
In this section
Configure metrics
Configure the OpenZiti controller, metrics bridge, and zrok controller to collect and store usage metrics in InfluxDB.
Limits
Configure metrics before setting up limits—the limits agent depends on the metrics