Live Audit
Live Audit is Customer Connect's real-time view of your whole network. It shows where your infrastructure is, how it's connected, how much traffic is flowing, and where problems are — across every customer, or scoped to a single one.
Live Audit is an observability tool: it reflects the network but doesn't change it. To change what's reachable, edit your access policies.
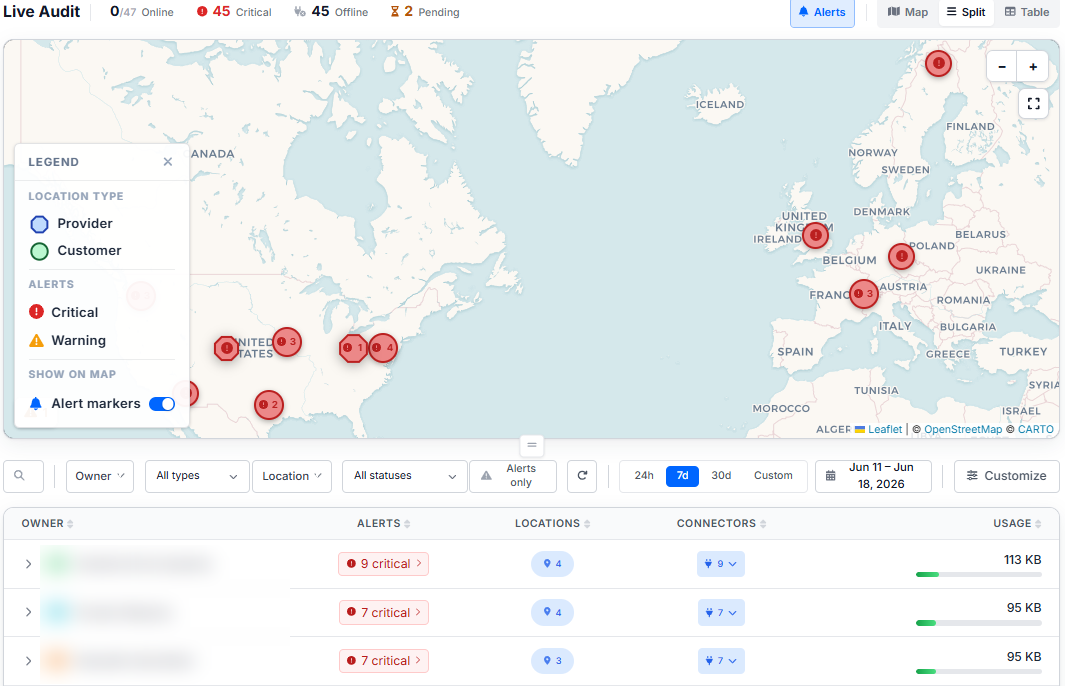
What it shows
- Locations: Provider-owned and customer sites, plotted geographically.
- Connectors: The software deployed at each location.
- Access policies: The rules linking sources to destinations, drawn as lines between locations.
- Alerts: Health issues surfaced by severity (Critical or Warning).
- Usage: Traffic volume per customer over the selected time range.
Views
Live Audit presents the same data three ways, and you can switch between them at any time:
- Map: A geographic map with location pins and the connection lines between them. Alert markers highlight locations with Critical or Warning issues, and a legend lets you toggle connection lines and alert tunnels on or off.
- Table: A per-customer breakdown with alert counts, location and connector counts, and usage.
- Split: The map and table together (the default), so you see the geography and the numbers at once.
Scope
What you see depends on your role and the View as customer toggle:
- A provider admin sees every customer's locations, connectors, and access policies on one view.
- View as customer scopes the view to a single customer's network (the same view that customer's admins see).
Time range
A time-range selector (24 hours, 7 days, 30 days, or a custom range) bounds the usage and alert data, so you can look at the current state or trend back over time.
Learn more
- Access policies: What the connection lines represent.