Dashboard
The dashboard is your landing page in Customer Connect. It gives an at-a-glance view of your whole network: how many customers and connectors you run, how much traffic is flowing, and which customers have problems.
Like Live Audit, the dashboard is read-only. It summarizes the network rather than changing it.
The dashboard is read-only, but you can click the + button from anywhere in the console to open the Quick Create menu. It has shortcuts to New Customer, New Location, New Connector Model, New Connector, and New Access Policy.
What it shows
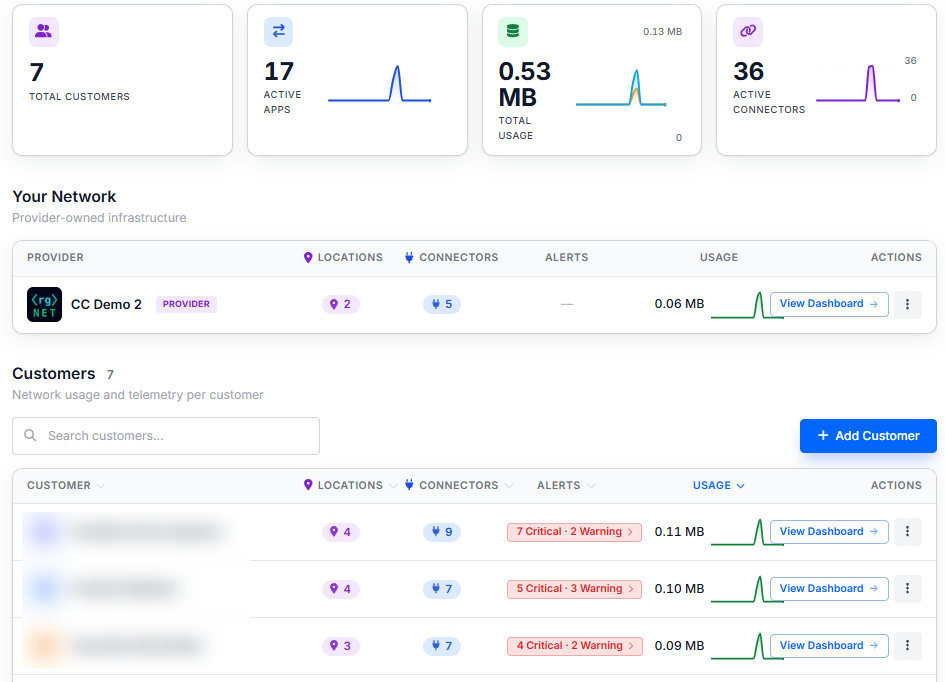
- Summary metrics: Headline counts for the selected time range — total customers, active applications, total usage (with a transmit/receive breakdown), and active connectors.
- Your Network: A summary of your provider-owned infrastructure — its locations, connectors, alerts, and usage.
- Customers: A per-customer table showing each customer's locations, connectors, alert severity (Critical or Warning), and usage, with a sparkline of recent traffic. Each row links to that customer's own dashboard.
Provider and customer dashboards
- The provider dashboard covers your entire network — every customer, plus your provider-owned infrastructure.
- Each customer has its own dashboard, scoped to that customer. Open it from the customer's row (View Dashboard), or by switching to View as customer.
A customer dashboard is organized into tabs: Summary, Recent Alerts, Access Policies, Locations, Connectors, Users, and Live Audit.
Time range
A time-range selector (24 hours, 7 days, 30 days, or a custom range) bounds the metrics and usage shown.
Learn more
- Live Audit: The real-time map and table view of network activity.
- Customers: The customer resource itself.